 Vancouver Trip Guide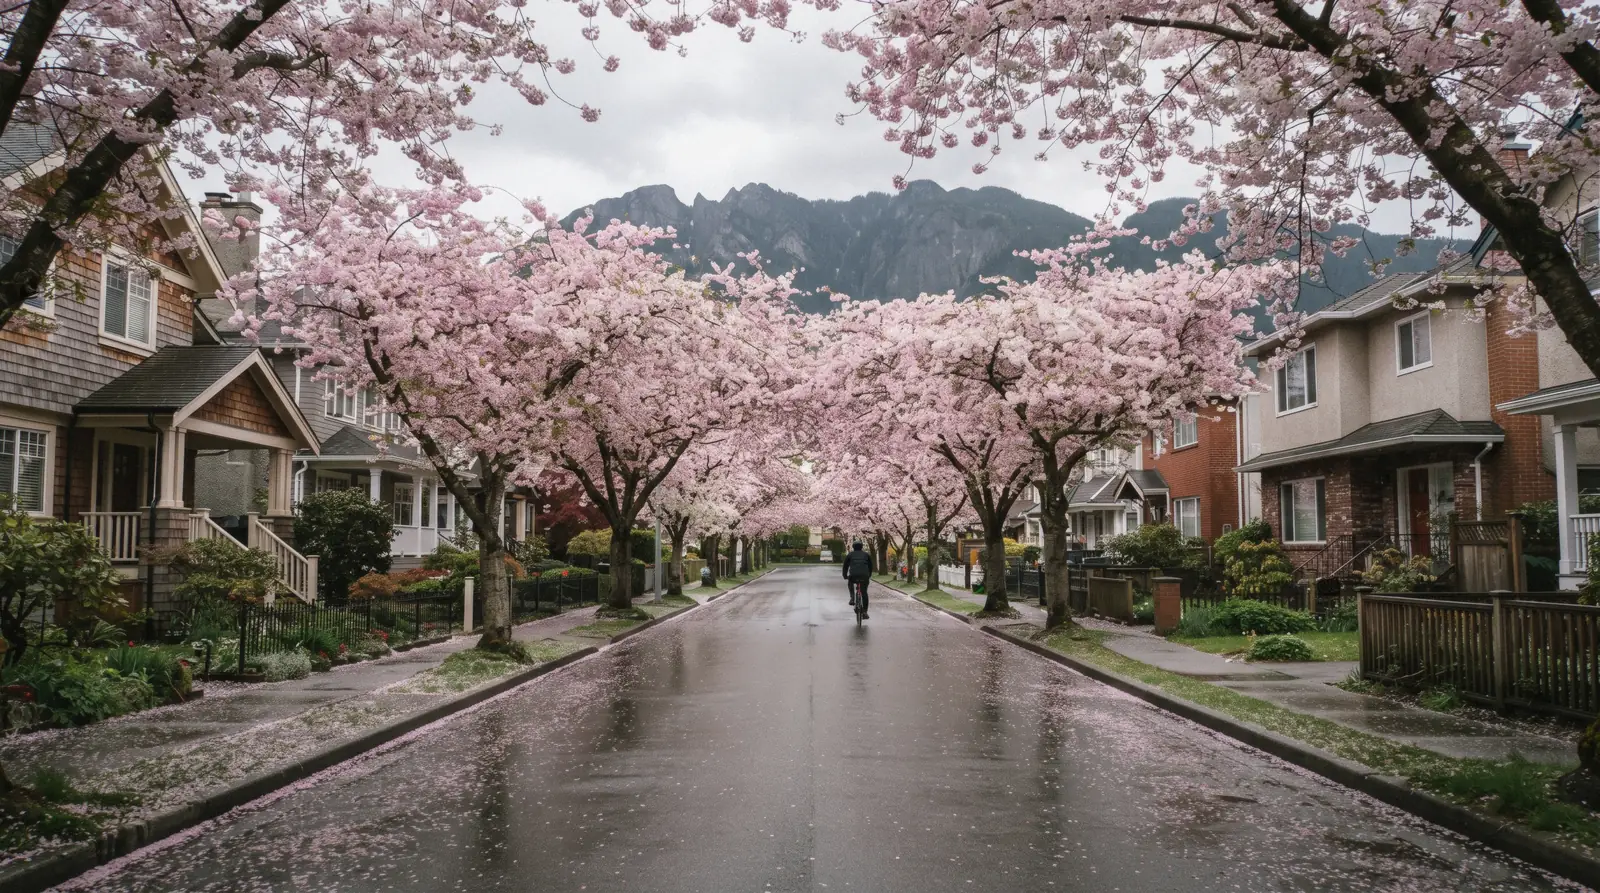
Best Time to Visit Vancouver
The best time to visit Vancouver is decided by two numbers that almost never appear on the same page: how warm it gets, and how often it rains. This guide separates them, because the sources do. Temperature comes from thirty full years of the ERA5 reanalysis at the city's own coordinates. Rainfall comes from Environment and Climate Change Canada's Canadian Climate Normals at Vancouver International, because the reanalysis nearly doubles the real rain over this coast and would have you packing for a city that does not exist. Around those figures sit the dates that actually move a trip: pool seasons, gondola maintenance, festival windows and the price bands that flip on a calendar day. The practical layers are on the Vancouver planning hub and the transit guide.
Quick answer The two good windows, the wet block, and the month nobody warns you about
July and August are the driest and warmest months in Vancouver, averaging 22.2 and 22.3 degrees Celsius by day and only 36 and 37 mm of rain across six or seven wet days. June and September sit one step behind on both counts and cost less. The wet block runs October to March, and November is the worst single month of the year at 189 mm over 20.4 days with measurable rain.
Key takeaways
- June and September are the value months: highs of 18.7 and 18.8 degrees, half the rain of the shoulder either side, and the summer attractions still running. The month chart and the weather table show the whole shape.
- November is the month to avoid on the numbers, and it is also when the Sea to Sky Gondola shuts for maintenance. If your dates are fixed, the wet weather plan matters more than the forecast.
- Whale watching has a season and a boat: the five hour catamaran into the Salish Sea sails from Granville Island with a free repeat trip if nobody sees anything.
- Winter is genuinely cheaper, not just quieter, and the gardens drop their prices on a calendar day. What winter looks like and what summer looks like each carry their own month.
- Almost everything that makes this city worth the flight costs nothing in any month: the seawall, the beaches and the parks are on the free list.
Vancouver Month by Month
Average daily high temperature by month in degrees Celsius, with the Fahrenheit reading printed underneath, computed from the Open-Meteo ERA5 reanalysis at 49.28 N, 123.12 W over the thirty full years from 1995 to 2024. The bands below the bars mix that series with Environment Canada's rainfall normals and with our own labelled reading of the visitor season.
August is the warmest month by a tenth of a degree over July and holds the warmest nights at 15.0 degrees, while July is the drier of the two at 36 mm against 37 mm. December has the coldest days at 5.4 degrees, which is why the chart floor sits at zero rather than below it. The Fahrenheit figures are rounded conversions of the same Celsius means, not separate measurements.
Vancouver Weather by Month, From Two Sources
Temperature is the thirty-year mean of daily maxima and minima from the Open-Meteo ERA5 reanalysis, 1995 to 2024. Rainfall and wet days are not from that series: they are Environment and Climate Change Canada's Canadian Climate Normals for 1981 to 2010 at Vancouver International, station 1108447, read from the GeoMet API in Q3 2026.
| Month | Average high | Average low | Rain | Days with rain |
|---|---|---|---|---|
| January | 5.9°C (43°F) | 1.5°C (35°F) | 168 mm | 19.5 |
| February | 6.9°C (44°F) | 1.5°C (35°F) | 105 mm | 15.4 |
| March | 8.8°C (48°F) | 2.8°C (37°F) | 114 mm | 17.8 |
| April | 12.0°C (54°F) | 5.0°C (41°F) | 89 mm | 14.8 |
| May | 15.9°C (61°F) | 8.7°C (48°F) | 65 mm | 13.2 |
| June | 18.7°C (66°F) | 11.8°C (53°F) | 54 mm | 11.5 |
| July | 22.2°C (72°F) | 14.6°C (58°F) | 36 mm | 6.3 |
| August | 22.3°C (72°F) | 15.0°C (59°F) | 37 mm | 6.7 |
| September | 18.8°C (66°F) | 12.5°C (54°F) | 51 mm | 8.3 |
| October | 13.2°C (56°F) | 8.2°C (47°F) | 121 mm | 15.4 |
| November | 8.4°C (47°F) | 4.1°C (39°F) | 189 mm | 20.4 |
| December | 5.4°C (42°F) | 1.5°C (35°F) | 162 mm | 19.7 |
The two series are deliberately not blended. ERA5 agrees with the observed record on temperature, matching July's high to within a twentieth of a degree, but its grid cell catches the rain that falls on the North Shore mountains and reports 2,166 mm a year against the 1,189.0 mm actually measured at the airport. Every rainfall figure on this page is the measured one.
Why the Rain Figure You Read Elsewhere Is Too High
Vancouver's reputation is built on a number that most travel pages take from a reanalysis grid rather than from a rain gauge. The gap is not small, and it is not random.
A reanalysis model divides the world into cells and estimates the weather inside each one. Over flat country that works. Over Vancouver it does not, because the cell that contains the city also contains the North Shore mountains, where air forced upward drops far more water than it does at sea level. The model averages the two and hands back a city that is twice as wet as the one you will walk around in. Environment and Climate Change Canada, by contrast, publishes what a gauge at Vancouver International actually caught over thirty years.
The difference matters most in exactly the months people are trying to decide about. Take the two figures for November side by side and one of them tells you to cancel.
Both series are kept in this site's research file so the choice can be audited. The measured annual total is 1,189.0 mm across 168.9 days with at least 0.2 mm; the reanalysis puts the year at 2,166 mm. Where this page prints a temperature it comes from the reanalysis, where it prints rain it comes from the gauge, and the two are never mixed inside one sentence.
| Month | Measured at the airport | Reanalysis grid cell | Overstated by |
|---|---|---|---|
| January | 168 mm | 293 mm | 125 mm |
| February | 105 mm | 174 mm | 69 mm |
| March | 114 mm | 239 mm | 125 mm |
| April | 89 mm | 151 mm | 62 mm |
| May | 65 mm | 110 mm | 45 mm |
| June | 54 mm | 85 mm | 31 mm |
| July | 36 mm | 46 mm | 10 mm |
| August | 37 mm | 64 mm | 27 mm |
| September | 51 mm | 124 mm | 73 mm |
| October | 121 mm | 249 mm | 128 mm |
| November | 189 mm | 337 mm | 148 mm |
| December | 162 mm | 294 mm | 132 mm |
Environment and Climate Change Canada, Canadian Climate Normals 1981 to 2010, VANCOUVER INT'L A, climate identifier 1108447, via https://api.weather.gc.ca/collections/climate-normals ; Open-Meteo ERA5 archive, https://archive-api.open-meteo.com/v1/archive . Both read in Q3 2026.
How Wet a Wet Day Actually Is
Vancouver records 168.9 days a year with measurable precipitation, which is the figure everyone quotes. The more useful one sits beside it in the same table: only 77.4 of those days deliver 5 mm or more. That leaves roughly 92 days a year, a quarter of the calendar, where the record says it rained and a visitor would describe it as grey with something in the air.
The distinction changes what you pack rather than whether you come. A hooded jacket handles the 92; the 77 want a proper shell and a plan. November is the month where the heavy days cluster, at 11.4 days of 5 mm or more out of 20.4 wet days in total. July has 2.4 such days in the whole month.
It also changes how you read a forecast here. A day flagged as rain in October is far more likely to be a wet morning and a bright late afternoon than a washout, which is why locals keep walking and why the wet weather page is built around half days rather than whole ones.
Month by Month, With the Dates That Change a Plan
Every temperature below is the thirty-year ERA5 mean for that month and every rainfall figure is the Environment Canada normal. The dated items come from each operator's own 2026 calendar, read in Q3 2026.
Vancouver in January
Highs of 5.9 degrees, lows of 1.5, and 168 mm of rain over 19.5 wet days. VanDusen Botanical Garden runs its shortest hours of the year at 10 am to 2 pm and Bloedel Conservatory closes at 4 pm, so a garden day is a short one. Granville Island's Public Market takes its only closed weekday of the year now, shutting on Mondays in January for maintenance, and Butchart Gardens closes outright from 18 to 31 January.
The compensation is real: garden admission sits in its low band and the city is emptier than at any other point in the year.
Vancouver in February
Highs of 6.9 degrees and 105 mm over 15.4 wet days, which makes February comfortably the driest month of the winter half, with 63 mm less rain than January for a degree more warmth. The cruise season starts at the end of the month and Canada Place begins to fill again. Mount Seymour is in the middle of its season, and winter tyres remain mandatory on the North Shore mountain roads.
A good month for museums, a poor one for viewpoints.
Vancouver in March
Highs of 8.8 degrees, and 114 mm over 17.8 wet days, the third highest wet-day count of the year. The Akebono cherries open in the last part of the month, a couple of weeks ahead of the Kanzan that most people picture. VanDusen extends to 5 pm and holds its low rate of $8.11 (CA$11.19) until the last day of the month.
Mount Seymour's season runs into early April, so this is the only stretch where snowshoeing and blossom overlap.
Vancouver in April
Highs of 12.0 degrees and 89 mm over 14.8 days, the first month that reads as spring rather than a break in winter. The Kanzan cherries follow the Akebono here, each tree flowering for around two weeks. VanDusen's high season starts on the first of the month and the adult ticket goes from $8.11 (CA$11.19) to $11.45 (CA$15.81).
Vaisakhi fills roughly five kilometres of South Vancouver streets on 11 April, and the Richmond Night Market opens on 24 April.
Vancouver in May
Highs of 15.9 degrees and 65 mm over 13.2 days. The city's summer rules switch on: drinking is permitted at seven named beaches from 15 May to 30 September, 11 am to 9 pm, over-19s only and no glass, and the Shipyards Night Market runs free on Friday afternoons and evenings from 15 May. The Museum of Anthropology drops its Monday closure and goes daily from 15 May.
VanDusen moves to 9 am to 6 pm. Rain is still frequent but rarely heavy, at 4.5 days of 5 mm or more.
Vancouver in June
Highs of 18.7 degrees and 54 mm over 11.5 days, which is the point where the curve breaks in your favour. Bard on the Beach opens under canvas in Vanier Park on 9 June and runs to 19 September, tickets from CA$30. Kitsilano Pool opens on 17 June.
Whistler's summer gondola season, PEAK 2 PEAK included, starts on 13 June at $79.70 (CA$110) for an adult, and the Gulf of Georgia Cannery in Steveston is free from 19 June. Hotel rates have not yet reached their peak.
Vancouver in July
Highs of 22.2 degrees, lows of 14.6, and 36 mm of rain over 6.3 wet days, making July the driest month of the year. Canada Together fills Canada Place on 1 July, free, and the parks drinking programme adds sixteen more parks for July and August. One thing to unlearn: the Honda Celebration of Light, the fireworks competition that most Vancouver guides still list for late July, has been cancelled indefinitely by the society that ran it.
TransLink's fares also rise on 1 July, so any fare printed before that date is stale.
Vancouver in August
Highs of 22.3 degrees and lows of 15.0, the warmest days and the warmest nights of the year, with 37 mm over 6.7 wet days. The Pride Parade runs on 2 August at the end of a week of events, and the PNE Fair opens on 22 August with an Any Day Ticket at $21.70 (CA$30). August carries the one weather risk that is not rain: Metro Vancouver issued five air quality advisories over ten days in the 2023 wildfire season, then a single three day warning in 2024 with no wildfire smoke in it at all, and states that smoke has affected air quality in seven of the last ten years.
Vancouver in September
Highs of 18.8 degrees and 51 mm over 8.3 days. On the numbers this is June repeated with slightly more rain, and it is the month where prices start falling while the weather has not. The list of things that end is long: the PNE closes on 7 September, Second Beach Pool has already closed, Kitsilano Pool closes on 13 September, Bard on the Beach on 19 September and the Richmond Night Market on 20 September.
Whistler's gondola price drops to $68.80 (CA$95) from 8 September, and VanDusen pulls its closing time back to 5 pm on the same day.
Vancouver in October
Highs of 13.2 degrees and 121 mm over 15.4 days, and the wet block resumes. The Vancouver International Film Festival runs 1 to 11 October with more than 160 films, Capilano's Canyon Frights runs 9 October to 1 November, and the cruise season ends on 13 October. The Museum of Anthropology starts closing on Mondays from 15 October and the Bill Reid Gallery switches to Tuesday to Saturday.
Winter tyres become mandatory on the North Shore mountain roads on 1 October, which catches drivers who booked a rental for a city break.
Vancouver in November
Highs of 8.4 degrees and 189 mm of rain over 20.4 wet days, 11.4 of them at 5 mm or more. Both figures are the worst of the year, and the month compounds it: the Sea to Sky Gondola closes entirely from 9 to 26 November for maintenance, which removes the best wet-weather day trip from the calendar. What opens instead is indoors or lit: Capilano's Canyon Lights from 20 November, and the Vancouver Christmas Market at Jack Poole Plaza from 16 November.
VanDusen returns to 10 am to 2 pm.
Vancouver in December
Highs of 5.4 degrees, the coldest of the year, with 162 mm over 19.7 days. Mount Seymour opens for the season on 11 December and the Christmas Market runs to 24 December. Closures cluster at the end: Butchart Gardens, Bloedel and VanDusen all close on 25 December, and Granville Island's Public Market closes on 25 and 26 December and 1 January.
Daylight is the real constraint rather than temperature, and it is the argument for building the day around an indoor anchor and treating the outdoors as the bonus.
What Changes Price With the Season
Six things a visitor pays for that carry a published seasonal band, read from each operator's own price page in Q3 2026. Canadian dollars are the official figures; US dollars are converted at the rate stated on the costs page.
The pattern is worth reading twice. The gardens and the mountain gondolas move with the season in a way the city attractions do not: Bloedel, the Vancouver Lookout and Science World charge the same in February as in July. So the seasonal saving in Vancouver is concentrated in exactly the places that are least pleasant in the low season, which is the honest reason the winter discount looks larger than it is.
The one real winter bargain is the hotel room, and nobody publishes the monthly figure that would prove it.
| What | Low season | High season | When the band flips |
|---|---|---|---|
| VanDusen Botanical Garden, adult | $8.11 (CA$11.19), January to March and November to December | $11.45 (CA$15.81), April to October | 1 April and 1 November, before GST |
| Butchart Gardens, adult | $18.25 (CA$25.20) in winter | $32.10 (CA$44.25) in summer | A dated calendar; closed 18 to 31 January and 25 December |
| Whistler PEAK 2 PEAK, adult | $68.80 (CA$95) in the fall season | $79.70 (CA$110) in summer | Summer 13 June to 7 September, fall 8 to 20 September |
| Sea to Sky Gondola, adult | $53.60 (CA$73.95) booked online | $59.40 (CA$81.95) at the window | No seasonal band, but closed 9 to 26 November |
| Bloedel Conservatory, adult | $6.88 (CA$9.50) | $6.88 (CA$9.50) | Flat all year, unlike VanDusen next door in the same park system |
| Downtown hotel, average daily rate | Not published by month | $248.50 (CA$343) for January to June 2026 | Destination Vancouver publishes no monthly curve at all |
vandusengarden.org, butchartgardens.com, whistlerblackcomb.com, seatoskygondola.com and Destination Vancouver's research page, all read in Q3 2026.
Crowds: What Is Counted and What Is Our Reading
Nobody publishes a monthly visitor curve for Vancouver. Destination Vancouver, the city's own destination marketing organisation, counts the year: 11.3 million overnight visitors in 2025 and CA$8.8 billion in tourism revenue. It also publishes downtown hotel performance, which is the closest thing to a seasonality signal that exists, at 76 percent occupancy and an average daily rate of $248.50 (CA$343) across the first half of 2026.
One figure inside that period should be ignored by anyone planning a trip. June 2026 alone recorded 73 percent occupancy at an average daily rate of $375.20 (CA$518). That is a World Cup number, produced by seven matches in the city over the same summer that the cruise season delivered nearly 360 calls and 1.4 million passengers through Canada Place. Budget from the half-year average, not from June.
Everything else said about crowds on this page is our reading and labelled as such. It is this: the pressure follows the cruise calendar rather than the weather, so late September has July's shoulder without July's ship traffic, and the first two weeks of June are the quietest genuinely warm stretch of the year. If you want the specifics behind that, the things to do hub says which places absorb a crowd and which do not.
Destination Vancouver, Tourism at a Glance and Research and Insights, https://www.destinationvancouver.com/about-us/research-and-insights , read in Q3 2026; Canada Place cruise season figures from canadaplace.ca.
The Best Month for What You Came For
Five common reasons for the trip, each with the month the published calendars actually support.
Whales
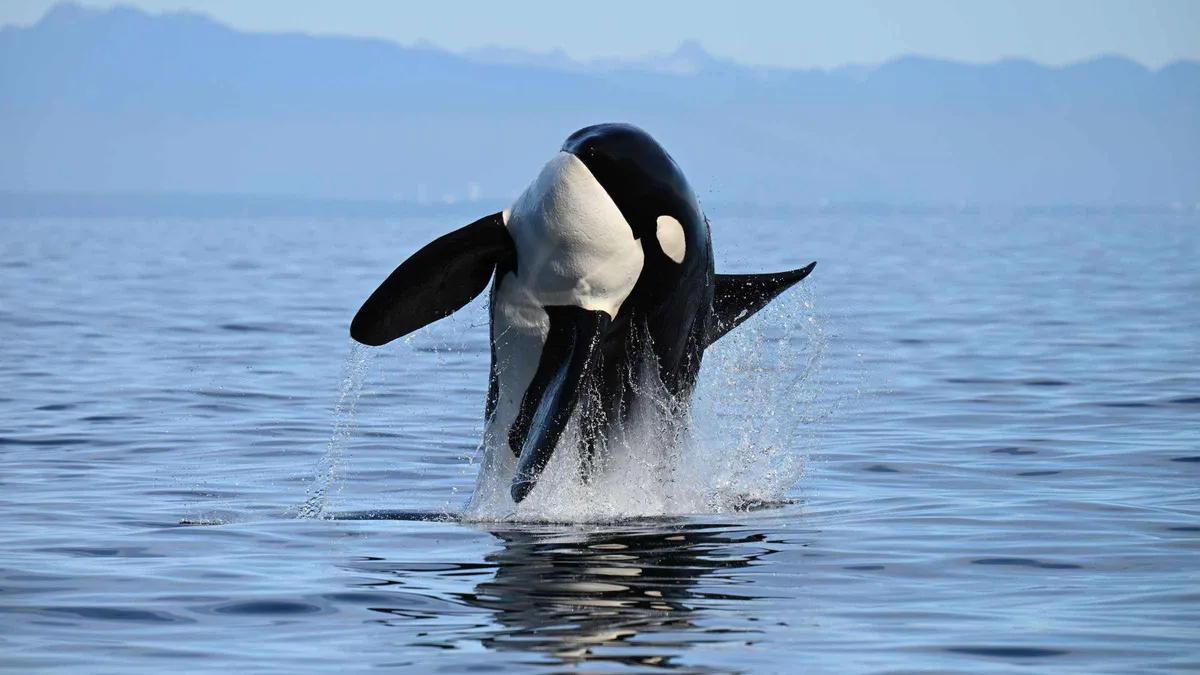
The boats sail out of Granville Island and Steveston into the Salish Sea, and the operators run their season across the warm half of the year. The five hour catamaran with a naturalist on board states outright that a trip with no sighting earns a free repeat trip, which is the only guarantee in this category worth anything. June to September gives you the flattest water and the longest daylight.
The dedicated whale watching page compares the three boats side by side.
Cherry blossom
Two waves, not one. The Akebono cultivar opens in the last part of March and the Kanzan follows a couple of weeks later in April, with each individual tree flowering for about two weeks. Fifty-four cultivars are planted across the city, so the season is longer than any single street suggests.
A separate page on this site covers where to stand and when.
Snow without a ski pass
Mount Seymour's season runs 11 December to 4 April, its snowshoe passes cost between CA$6 and CA$17, and no BC Parks day-use pass is needed for the snowshoe trails. Both Cypress and Mount Seymour Provincial Parks are free to enter. Winter tyres are mandatory on those mountain roads from 1 October to 31 March, which rules out most city rental cars, so the shuttles matter: Mount Seymour runs one from Rupert SkyTrain at CA$15 return, prepaid online only.
Hiking
June to September, and the constraint is not weather. The Stawamus Chief in Squamish closes its climbing routes from roughly 15 March to 31 July for nesting peregrine falcons, so the classic first-visit hike has a five month gap in the middle of the good season. The trails themselves stay open. The day trips hub has the drive times.
The cheapest possible week
January or February. The gardens are in their low band, the hotel market is at its softest, and the city's best assets, the seawall, the beaches and the parks, cost the same in every month, which is nothing. The trade is four hours less daylight and a one-in-two chance of rain on any given day.
If that is the trip, build it from the free list and buy one indoor ticket a day from the tickets index.
Four Bookings That Depend on the Month
One for the warm half, one for the wet half, and two that run across both. Prices, ratings and review counts are the operator's own figures as listed in Q3 2026.
 from $186.64
Top rated
from $186.64
Top rated Vancouver: Whale & Wildlife Watching Tour with Free Photos
Up to five hours into the Salish Sea on a covered catamaran with heated cabin, three viewing decks and a naturalist on board. Photos are included and a no-sighting trip earns a free repeat, which is worth knowing before you book a single-day visit.
Check Availability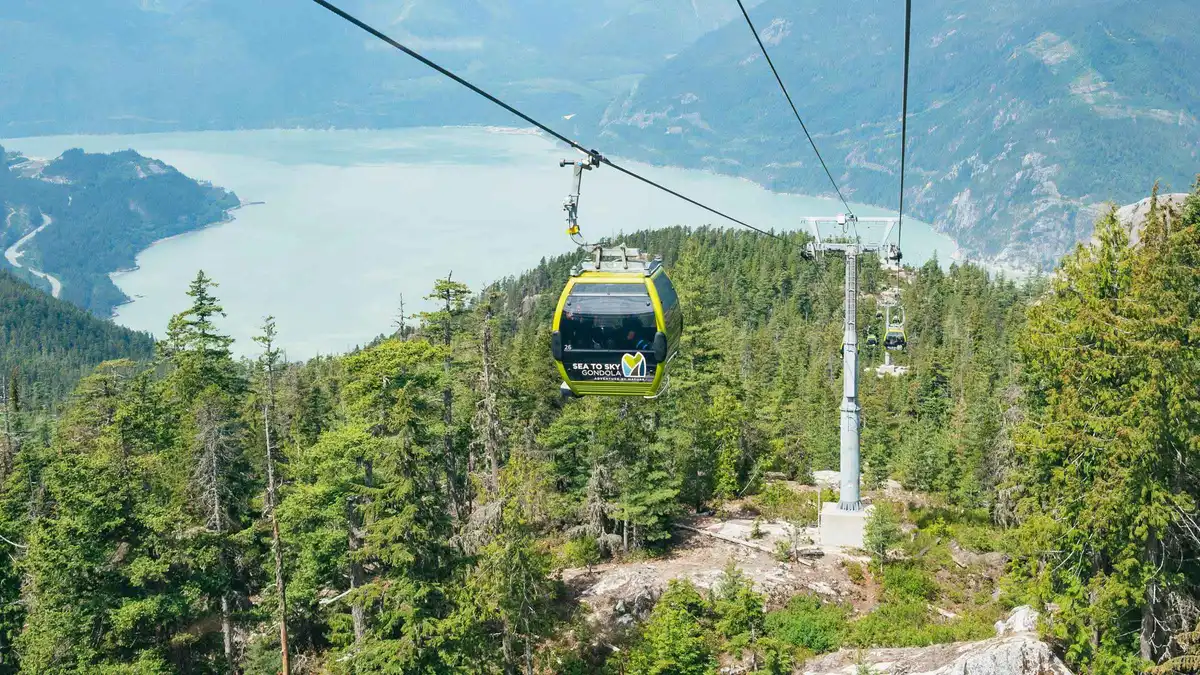 from $123.34
Certified by GetYourGuide
from $123.34
Certified by GetYourGuide From Vancouver: Whistler, Sea to Sky Gondola & Shannon Falls
Ten hours covering Shannon Falls, the Sea to Sky Gondola with 90 minutes at the Habrich Ridge summit, and free time in Whistler Village. The gondola ticket and hotel pickup are included, meals and tips are not.
Check Availability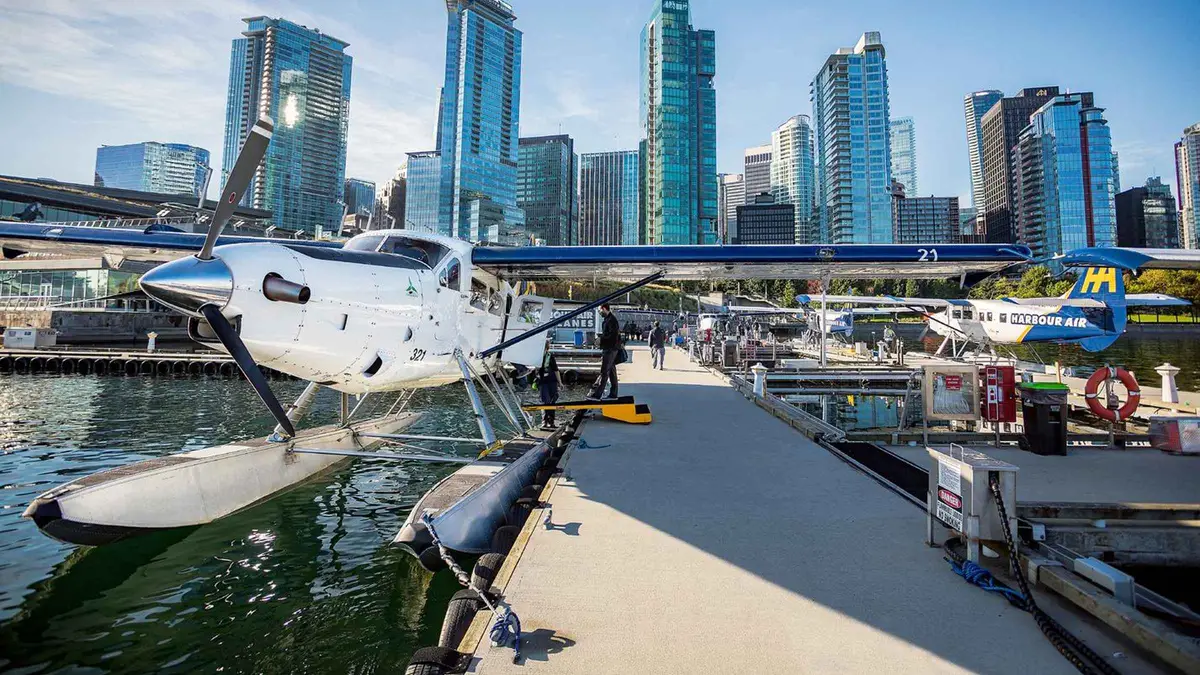 from $137
Top rated
from $137
Top rated Vancouver: Original Panorama Seaplane – Mountain & Coast
The original Harbour Air panorama: 30 minutes over Stanley Park, the Lions Gate Bridge, Horseshoe Bay and the downtown core, in a floatplane capped at eight seats. It leaves from Coal Harbour, a few minutes walk from the cruise terminal.
Check Availability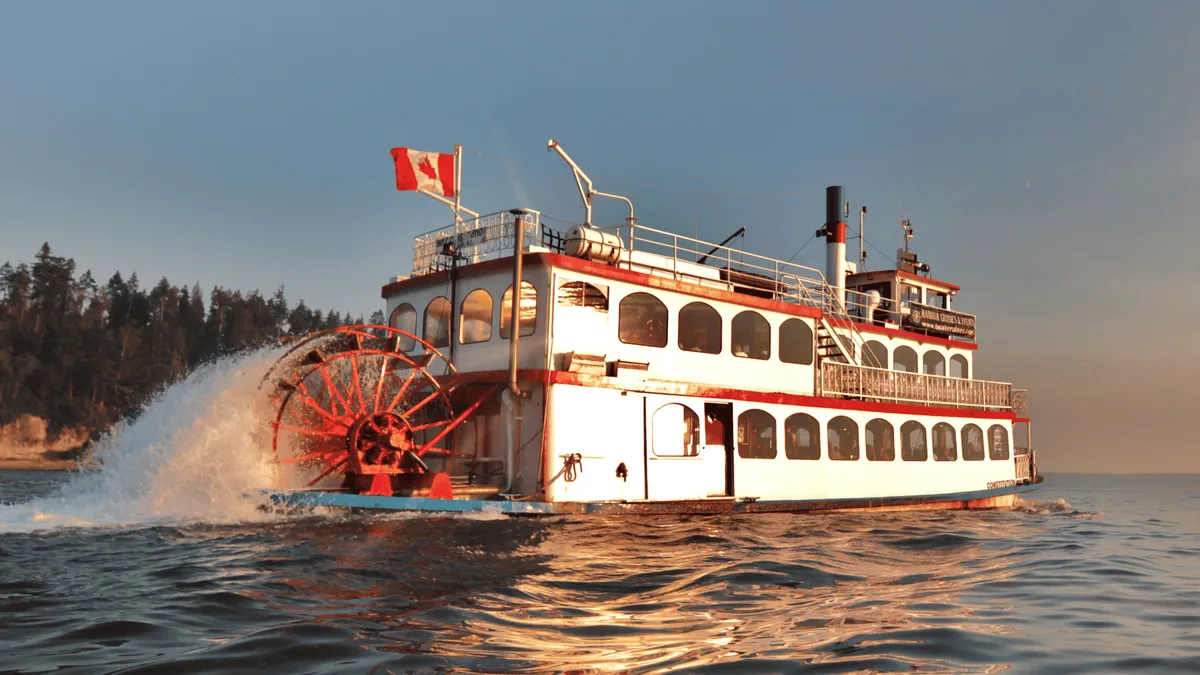 from $53.69
Vancouver: Harbor Sightseeing Cruise
One narrated hour around the inner harbour, past Stanley Park and under the Lions Gate Bridge, with open-air decks and a licensed bar on board. The shortest and cheapest way to see the city from the water.
Check AvailabilityPrices, ratings and details are the platform's own, checked in Q3 2026; dollar figures are the listed prices — the platform bills in your account's currency.
Once the Month Is Fixed
Three pages that take the date and turn it into a trip.
The season you picked, in detail
Each half of the year gets its own page with the hours, closures and clothing: Vancouver in winter and Vancouver in summer.
Two pages, six months eachWhat the trip will cost
Transit fares, the taxes nobody warns you about and a day priced three ways: what Vancouver costs a visitor.
Government tax on a hotel room: 18.5 percentThe plan for the days it rains
The indoor list with prices, the museums that are open on Mondays and the free evenings: Vancouver on a rainy day. Or start again at the Vancouver city guide.
168.9 wet days a year, 77.4 of them heavyBest Time to Visit Vancouver: Questions
What is the best time to visit Vancouver for warm, dry weather?
July and August. The thirty-year means put both at 22.2 and 22.3 degrees Celsius by day with 36 and 37 mm of rain across six or seven wet days, which is drier than most people expect of this coast. June and September give up roughly three and a half degrees and gain a few millimetres of rain, and both cost less, which is why the month chart treats June to September as one good block rather than two peak months and two shoulder ones.
Which month has the worst weather in Vancouver?
November, on both measures at once: 189 mm of rain across 20.4 days with measurable precipitation, 11.4 of them carrying 5 mm or more, and daytime highs down to 8.4 degrees. It is also the month the Sea to Sky Gondola closes for maintenance from 9 to 26 November. December and January are close behind on rain but neither combines the volume with the frequency the way November does.
How reliable is Vancouver weather by month for planning?
Reliable for the shape of the year, not for a given week. The temperature figures here are thirty-year means from a reanalysis that matches the observed record to within a twentieth of a degree in July, and the rainfall figures are measured normals from Environment Canada. What they cannot tell you is whether your Tuesday is wet, which is why the wet weather plan is built around swapping half days rather than cancelling them.
When should I come to Vancouver if I want the lowest prices?
January and February. VanDusen and Butchart sit in their low bands, the hotel market is at its softest point of the year, and the seawall, the beaches and the parks charge nothing in any month. Destination Vancouver publishes no monthly hotel curve, so the winter saving on a room is real but unquantified; the garden and gondola savings are published and sit in the season price bands.
Is there a month when things are closed in Vancouver?
There is no dead month, but there is a cluster. Butchart Gardens closes 18 to 31 January, the Sea to Sky Gondola closes 9 to 26 November, the Museum of Anthropology adds Monday closures from 15 October to 15 May, and Granville Island's Public Market shuts on Mondays in January only. The city's own museums mostly stay open on Mondays, which catches visitors used to the European pattern; the wet weather page lists which ones do close.
How does wildfire smoke affect when to visit Vancouver?
It is an August and early September risk and it is not annual. Metro Vancouver issued five air quality advisories over ten days in the 2023 season, then one warning over three days in 2024 that contained no wildfire smoke at all, and states that smoke has affected air quality in seven of the last ten years. There is no way to book around it, which is an argument for keeping an indoor option such as the Flyover flying theatre in reserve rather than for changing month.
Choosing Your Month, on Video
Three clips on the same question: a short seasonal rundown, a first-timer briefing that covers the weather trade-offs, and a long list of the mistakes visitors make with timing.
Why Spring is the Best Time to Visit Vancouver
The case for the March to May window, which the rainfall table on this page half agrees with.
Video: Destination VancouverVANCOUVER TRAVEL TIPS FOR 1ST TIMERS | 20+ Must-Knows Before Visiting Vancouver, BC + What NOT to Do
A first-visit briefing that spends real time on weather, clothing and what the rain is actually like.
Video: Happy to Wander (Travel Tips & Inspo)31 Tips I Wish I Knew Before Visiting Vancouver, Canada
Covers the timing mistakes this page argues against, including packing for the wrong kind of rain.
Video: Camden DavidVideos load from YouTube only when you press play.
Reviewed Q3 2026 (July–September 2026); next review Q4 2026. Prices, hours and terms are set by the venue or operator and confirmed at checkout.
We may earn a commission if you book through one of our links, at no extra cost to you. Full affiliate disclosure